
Thursday
Trade Balance.
The Trade Balance is a balance between exports and imports of total goods and services. A positive value shows trade surplus, while a negative value shows trade deficit. If a steady demand in exchange for exports is seen, that would turn into a positive growth in the trade balance, and that should be positive for the Currency.
Fibonacci retracement.
Fibonacci retracement is a very popular tool among technical traders and is based on the key numbers identified by mathematician Leonardo Fibonacci in the thirteenth century. However, Fibonacci's sequence of numbers is not as important as the mathematical relationships, expressed as ratios, between the numbers in the series. In technical analysis, Fibonacci retracement is created by taking two extreme points (usually a major peak and trough) on a stock chart and dividing the vertical distance by the key Fibonacci ratios of 23.6%, 38.2%, 50%, 61.8% and 100%. Once these levels are identified, horizontal lines are drawn and used to identify possible support and resistance levels.
FX Option Volatilities What are they?
FX option volatilities measure the rate and magnitude of the changes in a currency's price. Implied option volatilities measure the expected fluctuation of a currency's price over a given period of time based upon historical fluctuations. Volatility is measured by calculating the past annual standard deviations of daily price changes. Volatility is one of the key components of option pricing. Higher volatilities generally make option premiums more expensive. Professional option traders will typically buy options when volatilities are low and sell options when volatilities are high. Traders who only trade volatility need to hedge their options by buying or selling spot foreign exchange.
How is it used in Foreign Exchange?
When option volatilities are low - Look for a potential breakout When option volatilities are high - Look for range trading opportunities
Option volatilities are useful in timing FX movements. When currencies range trade it is likely that implied option volatilities are declining. The reason this happens is because range trading means lack of movement, by definition. When option volatilities have a pronounced movement downwards, this is usually a good signal for a significant upcoming movement and this is very important for both range and breakout traders. Traders who usually sell at the top of the range and buy at the bottom, can use this tool to predict when their strategy will stop working. Breakout traders can monitor option volatilities to make sure that they are not buying or selling into a false breakout.
The EUR/USD and GBP/USD charts on the following page contain examples of when sharp drops in option volatilities have predicted large moves in the FX market. These specific examples highlight upward movements, but are equally as useful for the inverse. In April of 2003, EUR/USD 3 month implied volatility took a sharp plunge downward when EUR/USD was trading within a tight range. If a trader bought EUR/USD based upon this move in option volatilities, he would have been in the market for the 700 pip move that occurred during the following 3 months.
There is also a case for GBP/USD. In April of 2003, option volatilities plummeted from 8% to 7.3%, while GBP was range trading. In the following months, GBP/USD rallied from 1.5550 to 1.6100. This strategy generally works well, but traders must be cautious because volatilities can have long downward trends. This is evidenced in the period between June 2002 and October 2002. Therefore, it is important that traders look for sharp movements in volatility as opposed to gradual ones, because declining volatilities can be misleading.
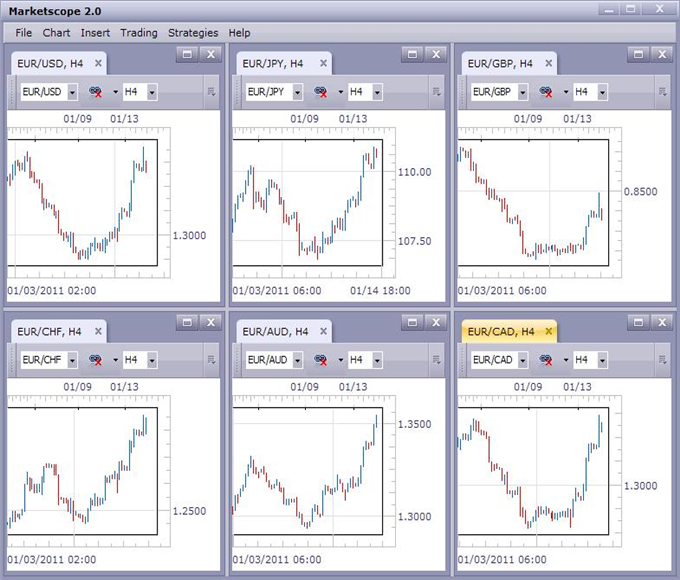
Buy the Strongest, Sell the Weakest.
One important tool FX traders can use in their analysis is the concept of relative strength. I'm not referring to the technical indicator RSI, but rather a comparison of the currencies to determine the strongest currency and the weakest currency. Once we identify those currencies, we can match them up and check the pair that includes both currencies and we should see a strong trending market.
Here are six 4-hour charts of different EUR pairs. The first thing we should notice is that the EUR has been moving up against all of these currencies for almost a week now. Short-term traders have many possibilities when looking for buys in that the EUR has been strong across the board. There is one exception though, the EUR has struggled against the GBP when compared with the other pairs. While those short-term traders might avoid buying the EUR/GBP, longer-term traders might find that information valuable too. Since the longer-term trend of the EUR has been down, some traders are looking for the EUR to reverse back to the downside. Noting how strong the GBP has been against the EUR on this move up could very well lead to a stronger move down if these markets do reverse. That might mean that selling the EUR/GBP on a reversal could offer a better chance of success than selling any other EUR pair.
Simple comparison between currencies can be done quite easily in the FX markets because of the match up of each currency with another in the pairs we can trade at FXCM. This is an edge to trading FX and is a valuable tool for FX traders.
Limit Entry.
Limit Entry (LE) Orders are orders to enter the market at a more favorable price. For example - if we were buying a currency pair, a Limit Entry order would be below the current market price. Only if the market went down to that price, would the order be able to be filled. If placing a LE on a short trade, entry price will be above current market price.
What’s the best way to determine if a pair is trending?
Instructor’s Response:
Thanks for your question on this very important topic.Take a look at the historical daily chart of the EURUSD below...
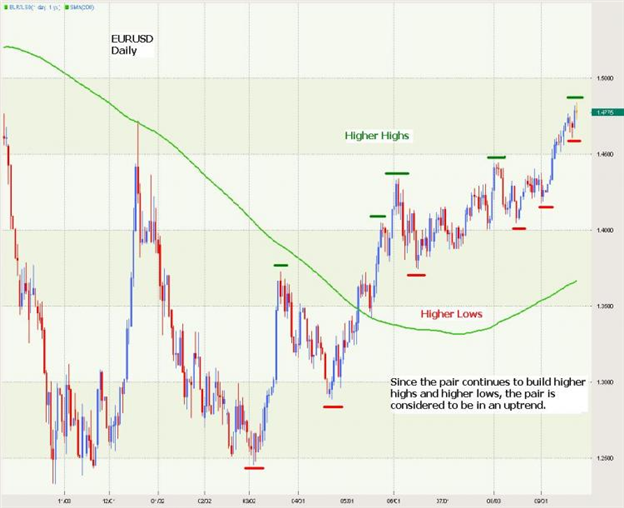
A pair on a lower time frame chart may appear to be trading in a range. So, to gain more insight I like to look at the bigger picture and consult a daily chart.
As can be seen on this chart, this pair demonstrates the most compelling signs that the pair is trending to the upside: it is building higher highs and higher lows. On the other hand, a pair that is in a downtrend will be building lower highs and lower lows.
Once the overall trend has been identified, the trader can then take advantage of that trend by only taking trades in that dirction.
Subscribe to:
Posts (Atom)